Digital transformation, paper and legacy systems in Japan
Part of: Japan Cybersecurity Tracker
Six weeks, 553 incidents: Japan's breach wave runs through vendors
The Japan Cybersecurity Tracker's first six weeks: 54% of disclosed incidents came through a vendor, and each vendor's customer list decided where the victims were.
Part 18 of a series on Japan’s cybersecurity blind spot. Start with the overview, Japan cyberattacks in 2026: what the breach wave reveals, or read the previous part, Don’t wait for the government. Fix the flaws before AI finds them..
Status as of 31 October 2026: the Japan Cybersecurity Tracker holds 553 disclosed incidents. Collection began in mid-October and earlier weeks were backfilled, so the early weeks are probably undercounted.
TL;DR: After six weeks of counting, 299 of the 553 incidents in the tracker (54%) are downstream victims of a compromised vendor. The public sector had 96 incidents, and only 12 did not come through a vendor. The location of the victims follows each vendor’s customer list, not any visible attacker preference. Adjusted for how many organizations are based in each prefecture, the one cluster outside Tokyo is the Fukuoka private sector, and a good part of it traces back to local service providers. The practical lesson for a company in Japan right now is that its risk is its vendors’ risk.
Seventeen parts of this series have covered individual breaches and what they show. Part 5 argued that you outsource the work but not the responsibility. Part 9, Part 10 and Whom Now Shall We Trust? followed the Studio, Commune and Arcadia breaches one by one. Part 2 warned that a headline is not a denominator.
This part does the counting. The tracker is fed by an automated job that runs almost every day and looks for new and updated Japanese disclosures. Each row is checked against its source, and each victim’s head office is checked against official records. Of the 549 incidents with a disclosure date, 505 were disclosed in October, 40 in September and 4 in August. Six weeks is not long, so what follows describes patterns. It does not establish trends.
The waves are vendors
Weekly disclosures, in weeks starting Monday, were 32, 95, 113, 167 and 114 from the week of 28 September to the week of 26 October. In the busiest week, starting 19 October, 106 of the 167 disclosures were downstream of a vendor.
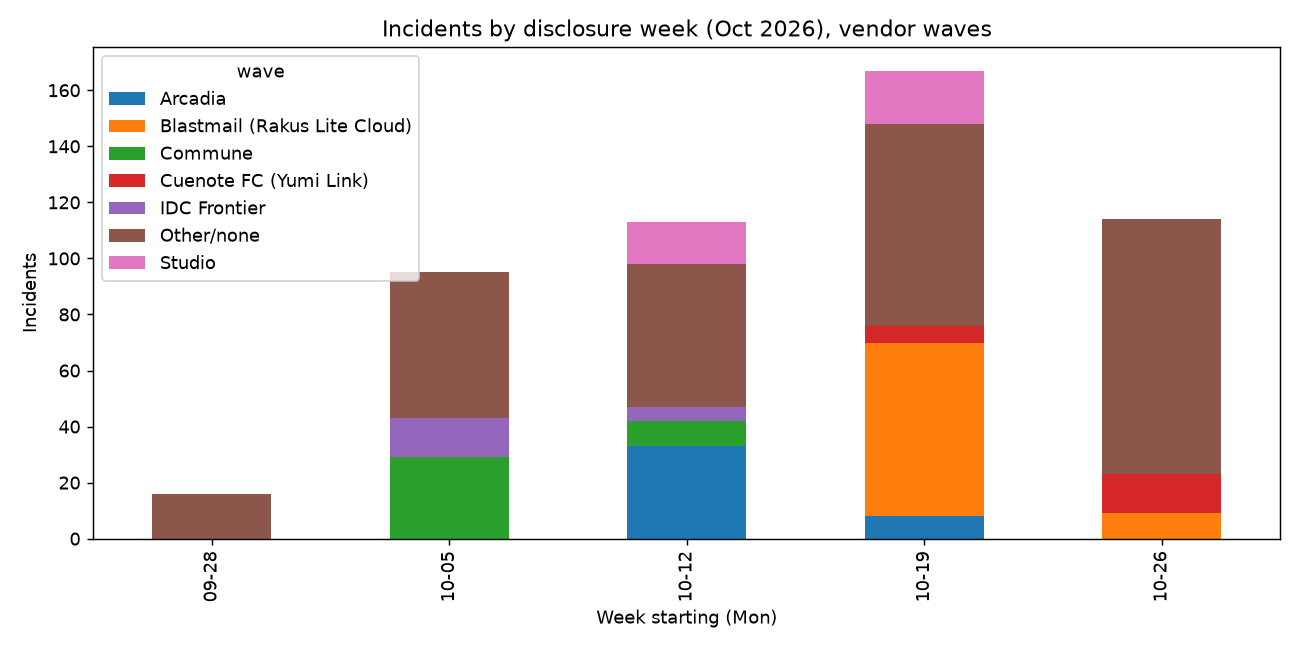
Six vendors produced the largest waves:
- Blastmail: 71 downstream disclosures, 21 to 30 October
- Arcadia: 42, 13 to 21 October
- Commune: 39, 8 to 14 October, 24 of them on 9 October
- Studio: 35, 16 to 23 October
- Cuenote FC: 20, 19 to 28 October
- IDC Frontier: 19, 7 to 14 October
Blastmail and Cuenote FC have not appeared in this series before. Both are email delivery services, and they came at the end of the window. Over the same two weeks, the number of incidents described as account or email compromise went up.
Incidents not linked to a vendor rose too, from 16 a week to 63. I would not yet say direct attacks are increasing. Because the early weeks were backfilled, some of that rise, and possibly most of it, is the tracker getting better at finding disclosures.
The public sector is mostly hit through suppliers
The public sector had 96 incidents. Arcadia accounted for 33 and Blastmail for 25, and only 12 did not involve a vendor. When a headline says another city office has been breached, this data says it is usually one supplier with many municipal customers.
Among incidents not linked to a vendor, the most affected sectors were IT and SaaS (56), retail and e-commerce (48), media (25) and education (24).
Mostly, we are not told how
Part 1 said that “a cyberattack” is not an explanation. The tracker shows how often that is the only explanation given. 376 incidents (68%) are recorded as unauthorized access with no method disclosed. Of the rest, 75 involved vulnerability, API or application flaws, and 61 involved account or email compromise.
Ransomware accounts for 33. It peaked at 16 in the week of 5 October and has run at about 2 a week since.
Where both the attack date and the disclosure date are known (n=288), the median time from attack to disclosure was 5 days, with an interquartile range of 3 to 13 days. The public sector was faster, at 3 days. Manufacturing (14.5 days, n=12) and travel and hospitality (19 days, n=9) look slower, but those samples are too small to rely on. Disclosures came most often on Fridays (141) and least often on Sundays (7).
The map follows the customer list
Victims are placed by head office, verified against official sources. 411 of the 553 have a verified location. The other 142 (26%) do not yet, and they are left out of everything in this section.
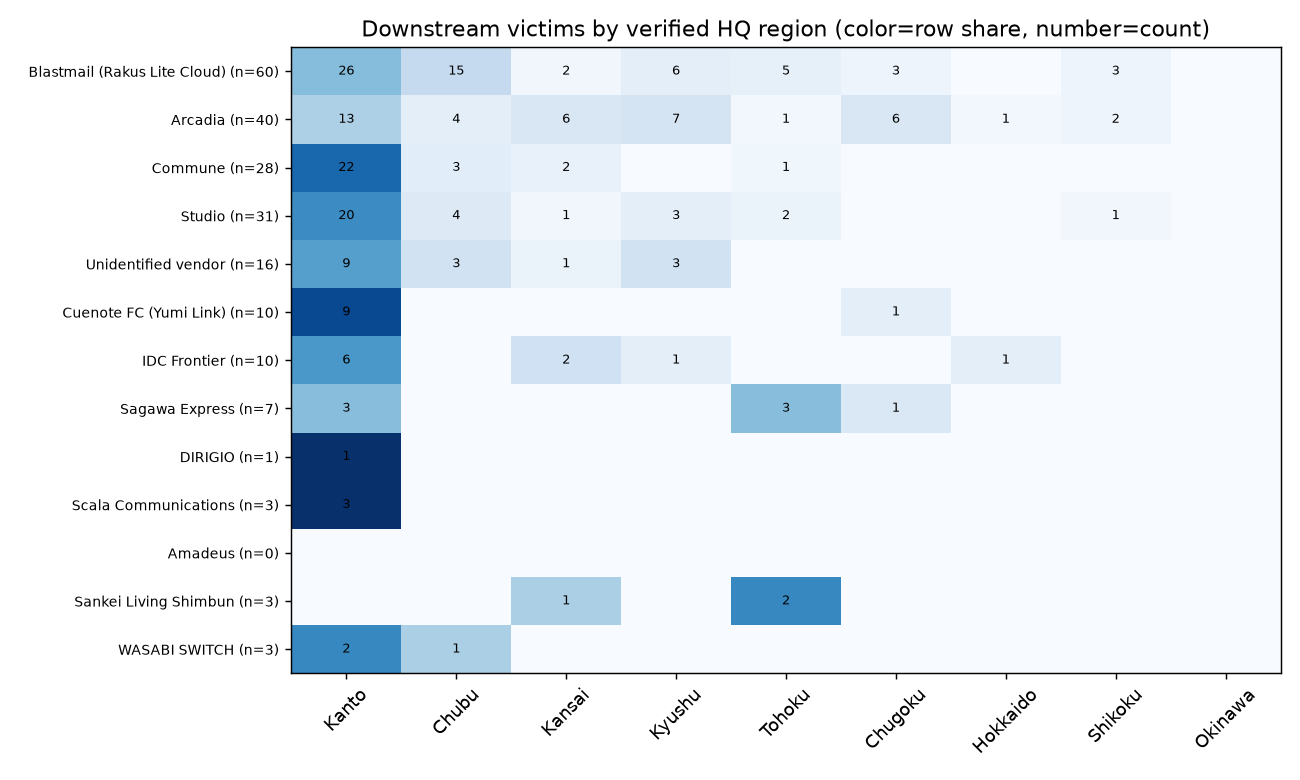
Tokyo has 53% of located victims, which is expected. More useful is that each vendor wave has its own geography, and it matches the vendor’s customers:
- Arcadia: 1 of 40 located victims was in Tokyo, against a baseline of about 58%. Its customers were mostly public bodies (32 of 41) spread across the country.
- Blastmail: 35% in Tokyo, against a 55% baseline (p=0.001), and 15 of 60 victims in Chubu, against a 10% baseline.
- Commune: 71% in Tokyo. That was not significant after correcting for multiple comparisons.
Incidents not linked to a vendor show no move away from Tokyo over the six weeks.
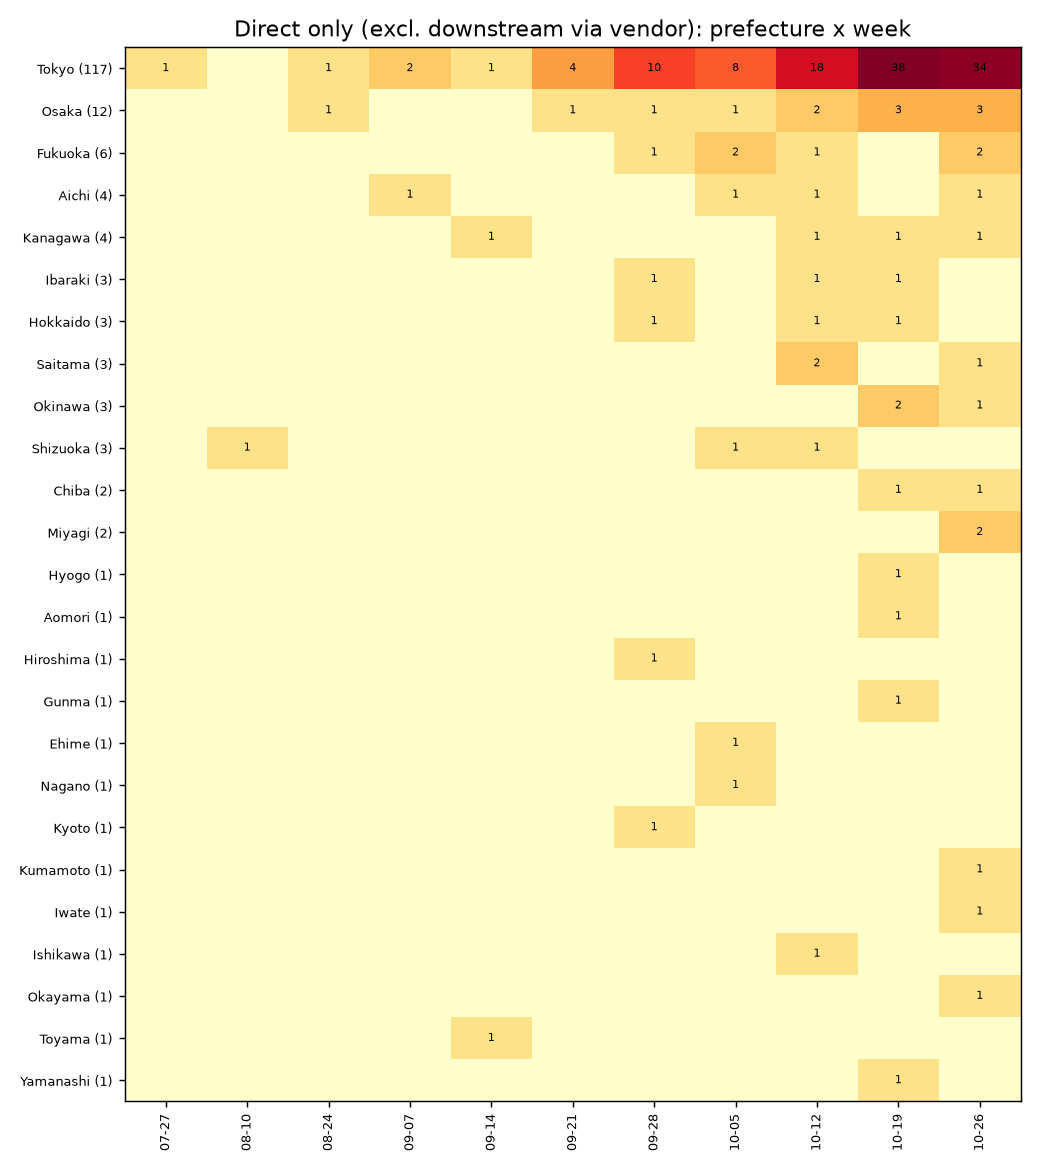
So the prefecture an incident turns up in mostly tells you which vendor was breached and who buys from it. It says little about where attackers are looking.
Fukuoka, adjusted for size
To follow Part 2’s warning, I compared each prefecture’s count with an expected count based on official denominators. For companies, that is corporations by head-office prefecture from the 2021 Economic Census on e-Stat. For the public sector, it is the MIC list of local government codes, updated January 2024.
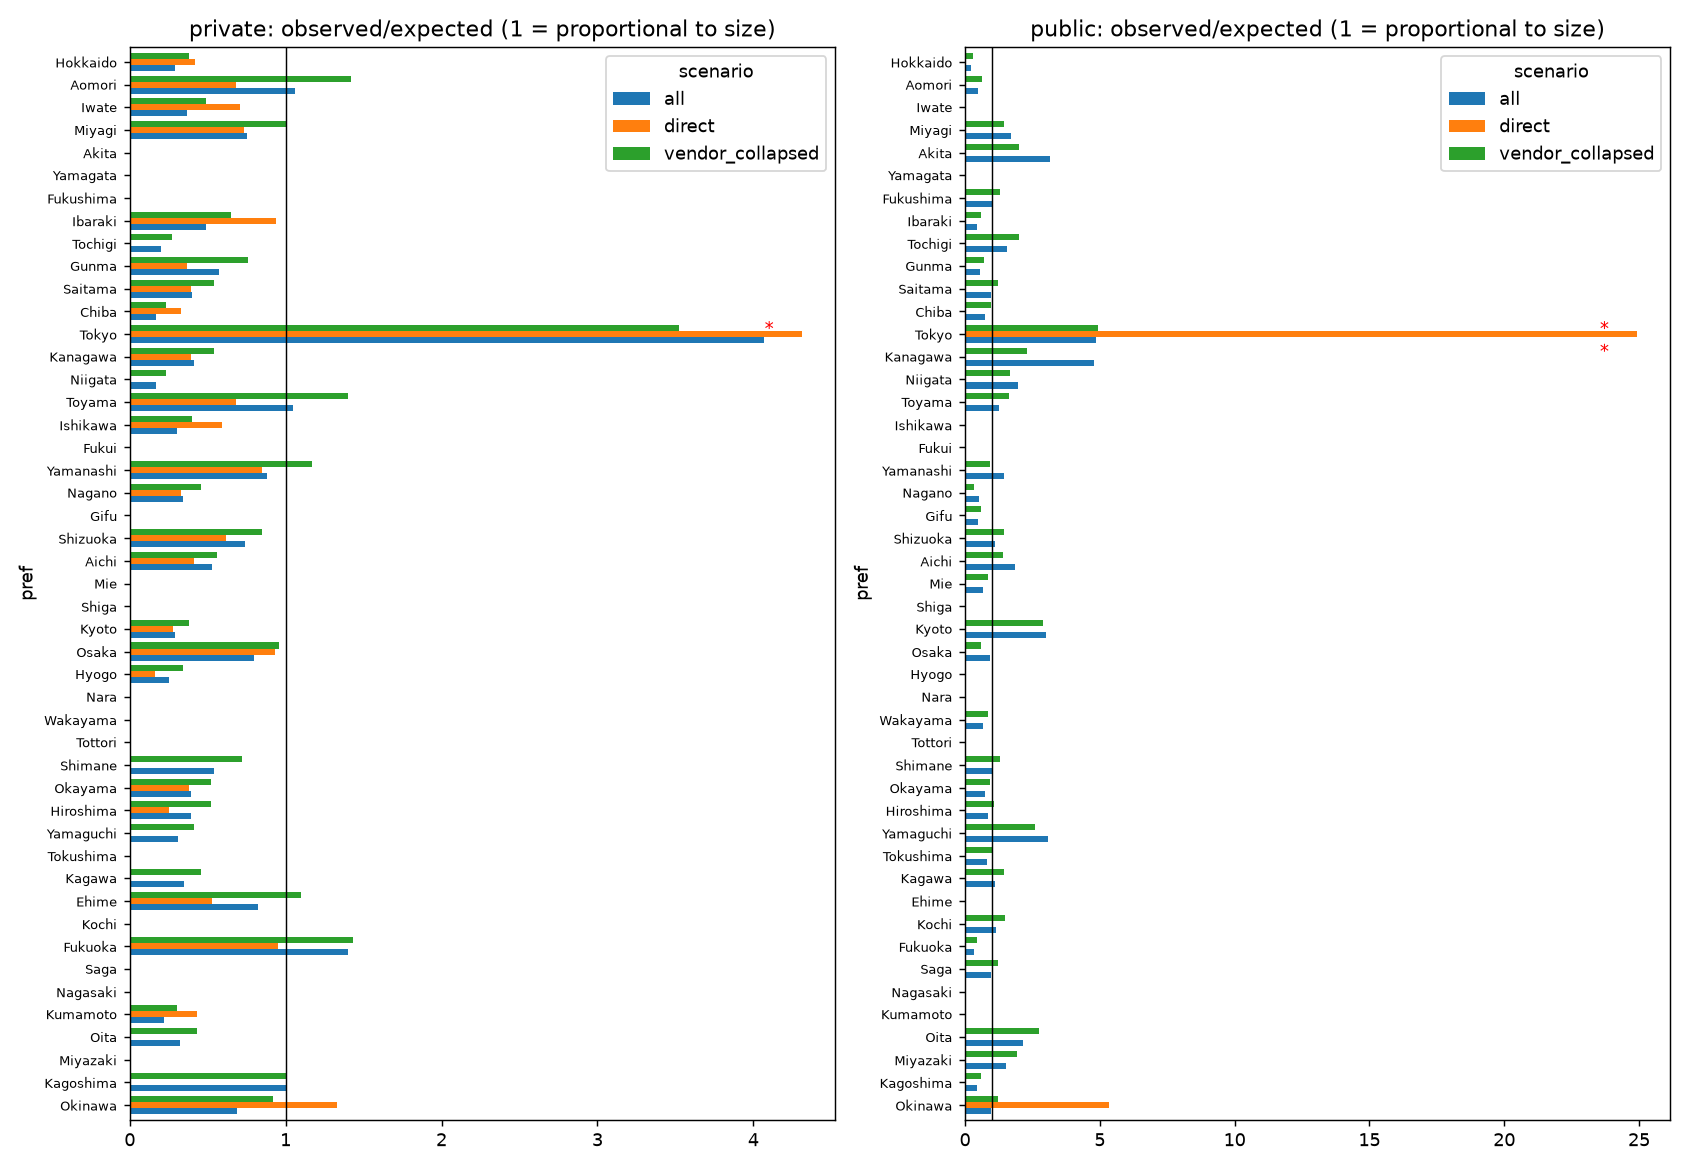
Tokyo comes out at 4.1 times expected. I read most of that as disclosure and head-office bias. It does not show that Tokyo is more dangerous.
Outside Tokyo, one result holds up: the Fukuoka private sector had 17 incidents against 5.4 expected (3.1x, q=0.002). If each vendor wave is counted once, it falls to 2.6x (q=0.09). With direct incidents only, it is 6 against 2.5, which is not significant. The incidents behind it:
- Local vendors that were breached themselves: Hotelier (7 October) and GoWeb Cloud (26 October)
- Downstream of local vendors: Sukesan via Kaho Enterprise (27 October), and a Kyushu University clinical-trial system via QLIFICA (28 October)
- Direct incidents: Moonstar, nimoca, Toypo and Ramrock
- National waves that reached Fukuoka: JR Kyushu (IDC Frontier), Nulab, Borderless Japan, Kyushu University alumni mail (Blastmail) and Fukuoka Growth Next (Studio)
Weekly Fukuoka counts were 1, 4, 3, 3 and 6. Nothing here shows Fukuoka is being targeted. What it does show is that Fukuoka’s local vendor ecosystem is worth watching. A national vendor’s breach spreads nationally, and a regional vendor’s breach stays regional.
Kanagawa is the contrast. Its public sector had 8 incidents against about 1.5 expected, which looks like a regional problem. All 8 came through vendors: Arcadia 5 (Yokosuka, Zama, Ayase, Hadano and Odawara), Blastmail 2 and Sagawa 1. None were direct. Osaka comes out at about 1.8 to 2.3 times expected depending on the method, which is not significant.
Don’t add up the records
The tracker’s headline total is 375,698,888 records, but that number cannot be added up meaningfully. Notices count different things: 36,084,359 people, 10,303,372 email addresses, 1,334,131 accounts, 1,786,751 card details and 75,489 form submissions. There are also 301,344,012 unspecified “件” (items), 647,014 in mixed units and 24,123,760 with no unit stated.
What does six weeks of Japan’s breach data show?
Six weeks of disclosed incidents in Japan, from August to October 2026, show that the breach wave runs mainly through vendors. 299 of 553 incidents (54%) in the Japan Cybersecurity Tracker were downstream victims of a compromised supplier, and only 12 of 96 public-sector incidents did not involve a vendor. Where victims are located follows each vendor’s customer base. Adjusted for the number of organizations per prefecture, the only cluster outside Tokyo is the Fukuoka private sector, which is partly driven by local vendors. The method is undisclosed in 68% of incidents.
What this means for your company
Treat your vendor list as part of your attack surface. Know which suppliers hold your customers’ data, which of them send email in your name, and who on their side will tell you, and how quickly, when they are breached. If you are outside Tokyo, include your regional providers in that list.
This is the work I do. Diagnostics maps what a company runs, which vendors sit in the middle of its data, and who is responsible for each. The Domain Exposure Check shows from public information what your domain already shows the outside world, including whether your vendors appear in the Cybersecurity Tracker.
Caveats
- Six weeks only. That is too short to establish trends.
- Collection began in mid-October and earlier weeks were backfilled. Early weeks are probably undercounted.
- Disclosed victims only. Incidents nobody announced are not included.
- Head office is not where the attack happened.
- 26% of incidents have no verified prefecture and are left out of the geographic analysis.
- Small samples. Significance is given where it was tested. Everything else is descriptive.
Sources
- Japan Cybersecurity Tracker (MKUltraman)
- e-Stat: 2021 Economic Census for Business Activity, enterprises by prefecture
- Ministry of Internal Affairs and Communications: Local government codes (updated 1 January 2024)
Data as of 31 October 2026. As the window grows, this article will get a dated update, in particular on whether the Fukuoka cluster holds.