Digital transformation, paper and legacy systems in Japan
Part of: Japan Cybersecurity Tracker
Japan cyberattack tracker update: what 1,435 public notices show so far
My Japan cyberattack tracker now holds 1,435 incidents disclosed from 1 June to 10 November 2026. As the record grows, the patterns are getting clearer.
Part of a series on Japan’s cybersecurity blind spot. All figures come from my Japan cyberattack tracker. The first update covered the tracker’s first six weeks.
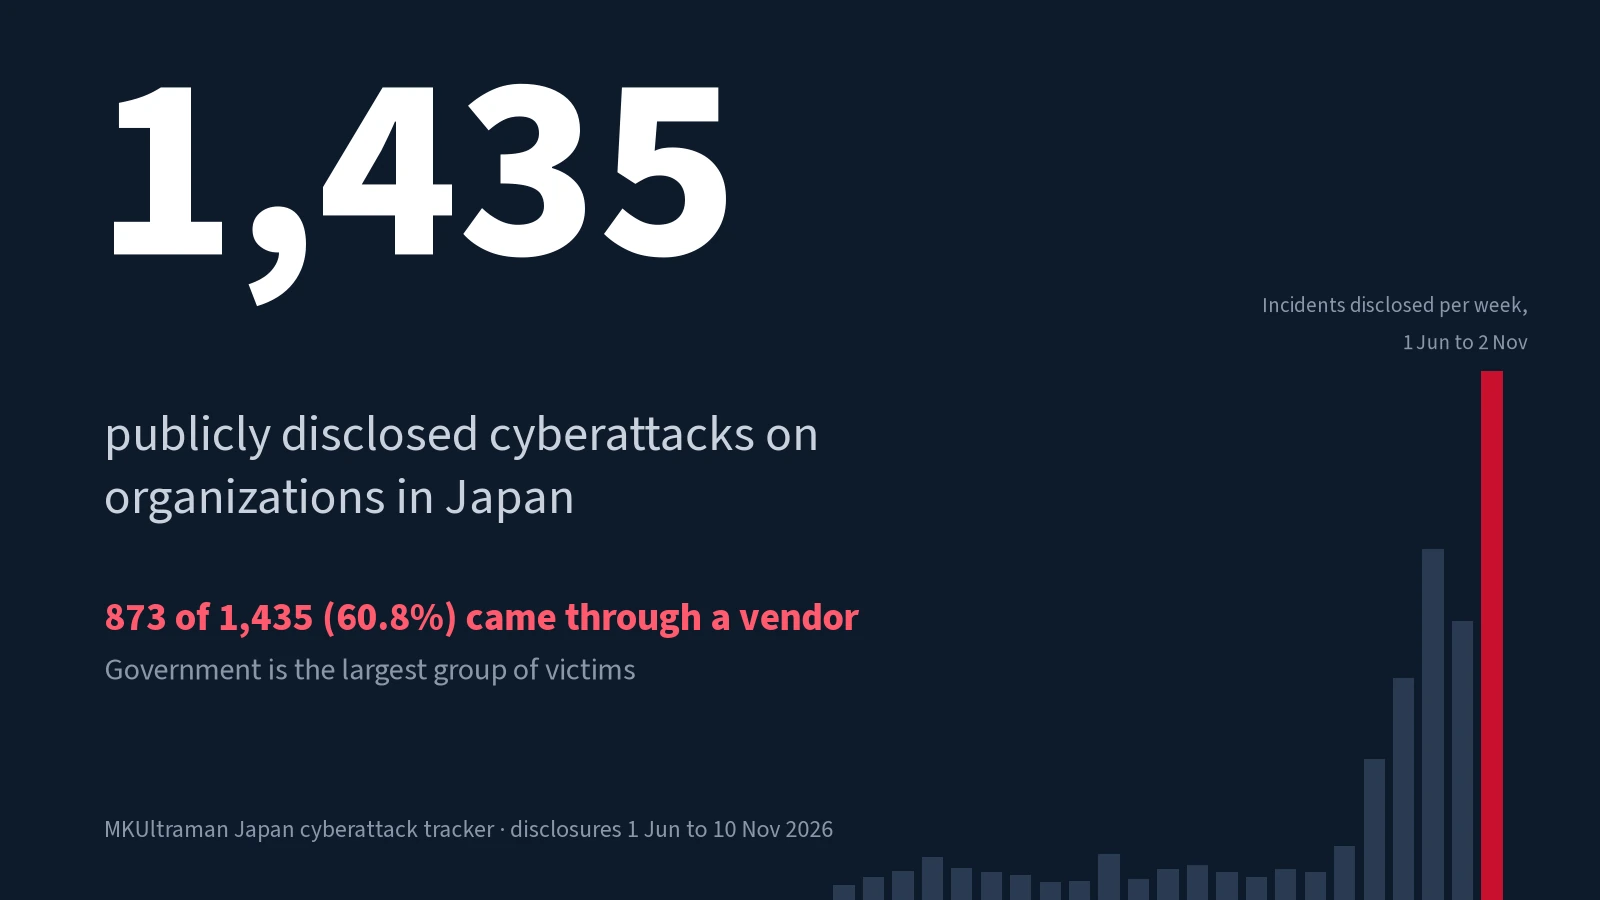
Since 19 October I’ve been logging every cyberattack on a Japanese organization that I can find a public notice for, and I’ve gone back through notices published from 1 June. As of 10 November the tracker holds 1,435 incidents. 873 of 1,435 (60.8%) reached the victim through a vendor, meaning a service the organization had hired, rather than through its own systems.
This is an update on what that record shows. New notices keep coming out, and as the dataset grows, a few patterns are getting clearer. A handful of vendors account for a large share of incidents. Local and national government is the largest group of victims, and it is hit almost entirely through vendors, while companies are more often breached directly. The organizations breached directly look much like the ones hit through a vendor. And most notices still say little about how the attacker got in.
What the tracker counts, and what it can’t
The tracker only contains incidents that were disclosed: the organization published a notice, or the press reported it. Anything that was never announced, or hasn’t been announced yet, is missing. So every number below is a floor. Other trackers, such as JP Incident Monitor, also collect Japanese incidents, and their counts will differ from mine.
Throughout this post, “direct” means the tracker records a breach of the organization’s own systems, and “through a vendor” means the notice comes from a customer of a vendor that was breached. 121 of the 482 direct notices (25.1%) don’t say either way whether a vendor was involved, so some of them may move as notices are updated.
The tracker adds up to 610,627,630 records affected. That is not a count of people. Organizations report in different units, and the total breaks down like this: 65,702,430 people, 401,218,421 records of unspecified kind, 9,404,304 email addresses, 23,700,851 accounts, 2,877,663 card details, 75,646 form submissions, 83,520,477 in notices that mix several units, and 24,127,838 where the unit isn’t stated. The same person can appear many times across those figures.
Direct breaches have run higher since late September
Here are the weekly figures, grouped by the week the incident was disclosed (weeks start on Monday). The last column counts vendors that announced a breach of their own service that week.
| Week of | Incidents disclosed | Direct | Through a vendor | Vendors announcing their own breach |
|---|---|---|---|---|
| 5 Oct | 96 | 34 | 58 | 4 |
| 12 Oct | 151 | 31 | 109 | 11 |
| 19 Oct | 239 | 42 | 174 | 21 |
| 26 Oct | 190 | 62 | 114 | 13 |
| 2 Nov | 360 | 62 | 289 | 8 |
A few notices are labelled unclear, so the columns don’t always add up to the totals. The week of 9 November has only just started (32 incidents so far), so I’ve left it out.
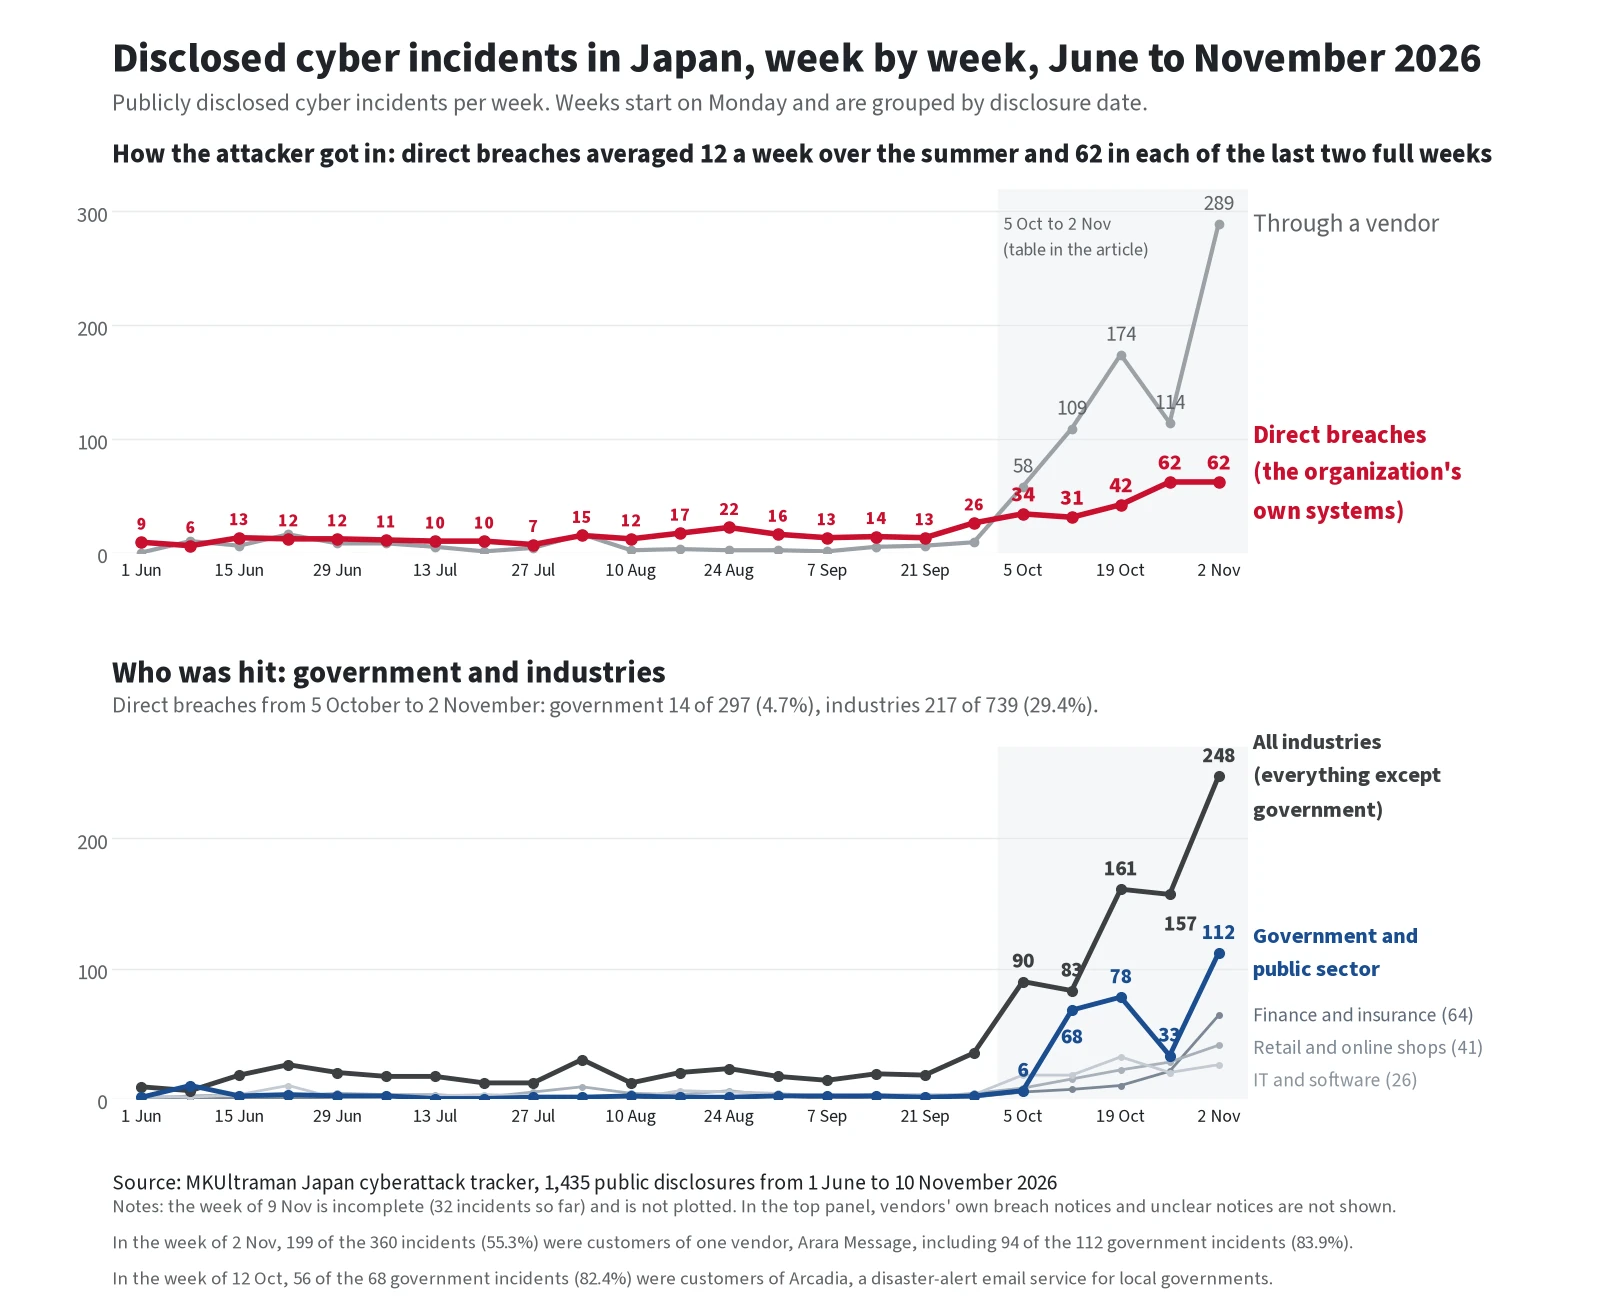
Most of the total for the week of 2 November is one vendor. Arara Message, a bulk email delivery service run by Arara, a Tokyo company in the PayCloud Holdings group, announced on 28 October that attackers had taken data from its shared environment and client servers. Its customers then published their own notices, and they made up 199 of the 360 incidents that week (55.3%). Without Arara, the week of 2 November has 161 incidents, against 182 the week before. I wrote about what the Arara Message breach involved when it broke.
ANN reports, in Japanese, on the Arara Message breach and the scam emails sent through the service. Video: ANN Good! Morning report, 3 November 2026 from ANNnewsCH.
That is why I follow the direct count alongside the total. A single vendor breach can produce hundreds of customer notices in a week. Direct breaches aren’t tied to any one vendor’s customer list: each is an organization saying that its own systems were broken into. From the week of 1 June to the week of 14 September, direct breaches ran at 6 to 22 a week, 12 on average. From late September the count moved higher: 26 in the week of 28 September, then 34, 31, 42, 62 and 62.
The direct breaches in the last two full weeks include large, well-known names reporting problems in their own services: Ryohin Keikaku’s MUJI app, Club Tourism’s internet booking members, Kyushu Electric Power Transmission and Distribution and SignalTalk’s Maru-Jan online mahjong service.
Some of the rise is probably more disclosure and more attention as well as more attacks. After the PHP2Shell vulnerabilities in October and the Arara breach, more companies went looking through their logs, and breach notices got more press coverage. I can’t fully separate the two from public notices. The June to September figures also come from one search back through old notices, while everything since 19 October was logged as it came out, so the summer weeks are more likely to be missing some incidents.
The tracker also groups incidents by the week they were discovered, but only 630 of 1,435 notices (43.9%) give a discovery date, and incidents discovered recently mostly haven’t been announced yet. The discovery counts for the weeks of 26 October (83) and 2 November (50) are lower than the weeks before them for that reason, and they will fill in as more notices come out.
Four vendors account for almost a third of the list
451 of 1,435 incidents (31.4%) are customer notices that trace back to four services:
- Arara Message (216 incidents): the bulk email delivery service described above.
- Blastmail (99): an email newsletter service run by Rakus Lite Cloud, a subsidiary of Rakus, which announced a breach of its servers on 21 October.
- Arcadia (69): a company in Minoh, Osaka, whose SpeeCAN RAIDEN service sends disaster and crime alerts for local governments. It put its possible exposure at up to about 3.14 million email addresses.
- Studio (67): a Tokyo no-code website builder that announced unauthorized access to its cloud environment on 16 October. I covered what the Studio breach exposed separately.
Three of the four hold the same thing: lists of email addresses that their customers collected from the public. These are small companies serving thousands of clients, and as far as I can tell from public information, all four run their services from Japan. When one of them is breached, every organization that uploaded a mailing list to it is breached too, whether or not it ever thought of that service as part of its security. The Commune breach worked the same way: one community platform, 29 organizations exposed.
An English explainer on how attackers reach an organization through its suppliers and service providers. Video: Supply Chain Vulnerabilities - CompTIA Security+ SY0-701 - 2.3 from Professor Messer.
Government is the largest group of victims
339 of 1,435 incidents (23.6%) are in government and the public sector: prefectures, cities, towns and public bodies. That is almost twice the next largest groups, retail and e-commerce (174) and IT and software companies (168).
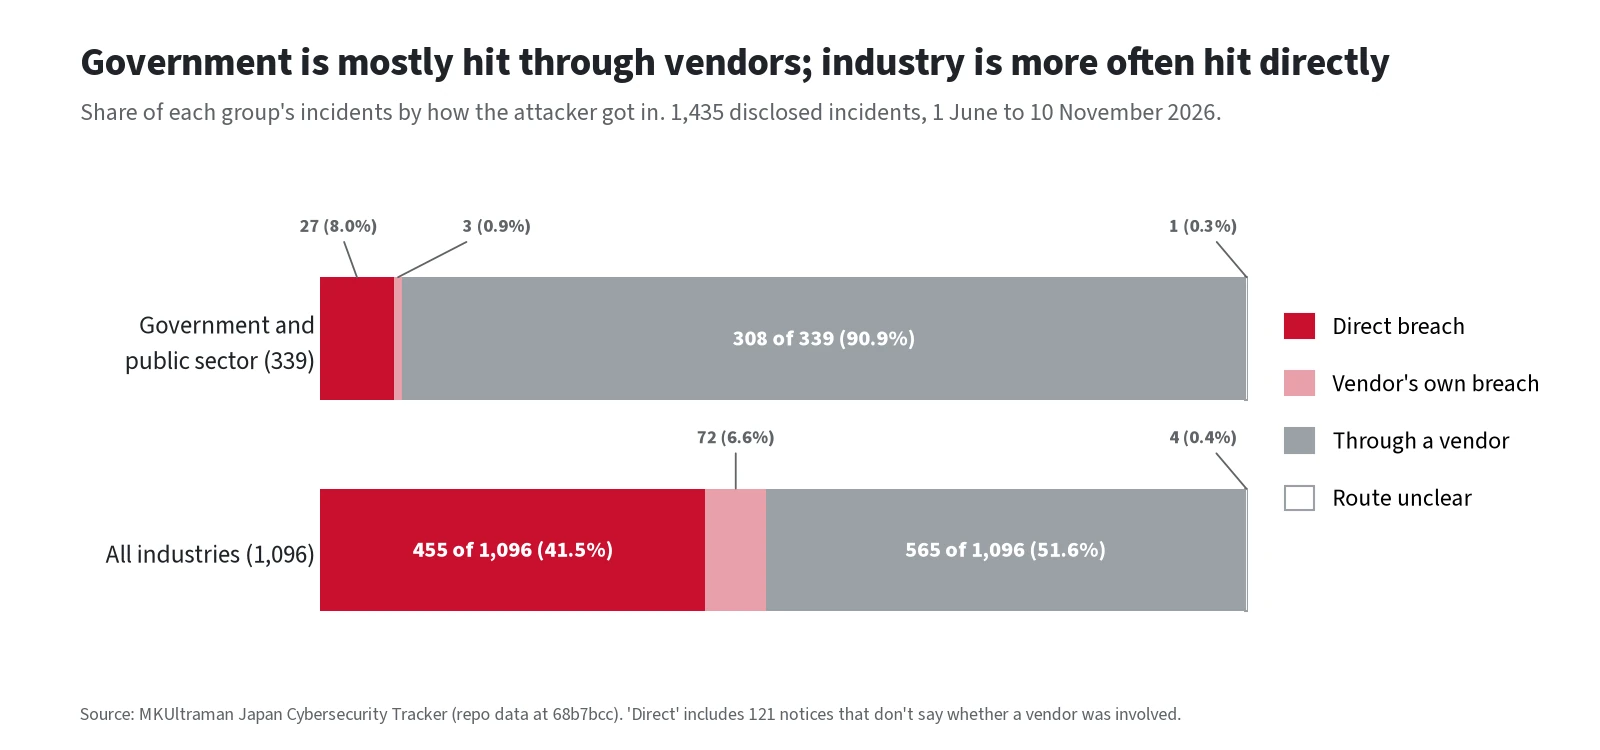
Almost all of those came through a vendor: 308 of 339 (90.9%), mostly the same few, Arara Message (95), Arcadia (60) and Blastmail (37). Only 27 of 339 (8.0%) were direct breaches. Local governments use these services to send newsletters, event notices and disaster alerts. When Arcadia was breached, several cities suspended their alert emails. A breach at one small vendor ended up switching off public safety messages. I wrote about what the Arcadia breach did to trust in official alerts.
ANN reports, in Japanese, on several local governments affected by unauthorized access to the alert delivery system. Video: 複数自治体で個人情報漏洩か 配信システムに不正アクセス(2026年10月14日) from ANNnewsCH.
Week by week, government incidents went 6, 68, 78, 33 and 112 from the week of 5 October to the week of 2 November, rising and falling with each vendor breach: 56 of the 68 in the week of 12 October (82.4%) were Arcadia customers, and 94 of the 112 in the week of 2 November (83.9%) were Arara customers. Incidents in industries, meaning everything outside government, went 90, 83, 161, 157 and 248 over the same weeks, and 217 of those 739 (29.4%) were direct breaches, against 14 of 297 (4.7%) for government.
Every one of the 47 prefectures has at least one organization in the tracker. Vendor breaches spread furthest, largely through local governments: where the head office is known, 298 of 747 vendor-route incidents (39.9%) are in Tokyo, against 229 of 394 direct breaches (58.1%).
Who is hit directly, and who through a vendor
Over the whole period, 455 of 1,096 industry incidents (41.5%) were direct breaches, against 27 of 339 for government (8.0%). Even counting only direct notices that rule a vendor out, industry’s share would be 330 of 1,096 (30.1%), still far above government’s.
Breaking into one organization at a time looks like a poor trade next to a vendor breach that reaches hundreds of customers, yet it keeps happening. Of the 482 direct notices, only 169 (35.1%) name a method, and most are cheap and repeatable: exploited software flaws in 44 (9.1%), email or admin account takeovers in 40 (8.3%), ransomware (software that locks files and demands payment) in 34 (7.1%), phishing, malware or fake tech-support scams in 27 (5.6%), leaked password lists in 12 (2.5%), and card skimming from tampered checkout pages in 10 (2.1%). Attackers run these by script or mass email against thousands of targets, so each victim costs little, even if each gain is small.
Were the defenses just that weak? Where a cause is given, it is basic: unpatched software, phishing, stolen logins, reused passwords. But the victims include large listed groups, universities and hospitals, and 375 of 482 direct notices (77.8%) give no cause, so mostly I can’t tell.
No notice states a motive. The visible signs lean to quick money: card details appear in 61 of 482 direct notices (12.7%) against 51 of 873 vendor-route notices (5.8%), and bank details in 18 of 482 (3.7%) against 4 of 873 (0.5%). The harm reported afterwards is fraud: a payment to a fake executive, a school paying a fake tech-support scammer, spoofed emails to customers. Only 8 of 482 direct notices (1.7%) mention a post on a leak site (where criminals publish stolen files), an extortion email or published files. Attackers are rarely named: Keio confirmed a claim by the Qilin ransomware group, and the Exitium group reportedly named Koike Sanso. No notice blames a state. My inference is that most direct breaches come from opportunistic attackers working at volume.
The victims look much the same on both routes. Among non-government organizations, 148 of 406 breached directly (36.5%) are listed or part of a listed group, against 182 of 509 hit through a vendor (35.8%). 34 of 406 (8.4%) against 54 of 509 (10.6%) are in the Nikkei 225, Japan’s main stock index, themselves or through their group, and 212 of 406 (52.2%) against 290 of 509 (57.0%) have a Japanese Wikipedia article. Median capital is ¥1.24 billion against ¥3.00 billion. NTT Docomo, Recruit, AEON, Rakuten and Nitori were breached directly; SMBC, KDDI, Panasonic, Suzuki and Kirin were hit through a vendor. Capital is not net worth, the size figures cover only the better-known half of each group, and the summer search-back applies here too, so treat these as approximate.
TBS reports, in Japanese, on Nitori’s announcement that member information may have leaked after unauthorized access found on 6 November. Video: TBS NEWS DIG report, 9 November 2026 from TBS NEWS DIG Powered by JNN.
On this record, direct breaches in industry are common, mostly done with cheap, repeatable methods, more likely to involve card and bank details, and they land on organizations of much the same size and standing as vendor breaches.
Most notices don’t say how it happened
1,124 of 1,435 notices (78.3%) say only that there was “unauthorized access” and give no method. Even among direct breaches, where the organization controls its own systems and should know more, 313 of 482 (64.9%) say nothing about how the attacker got in.
The rest are thin too. Ransomware is named in 68 of 1,435 incidents (4.7%). Passwords were exposed in 163 of 1,435 (11.4%). Where a notice gives both dates, the median gap between discovering an incident and announcing it is 3 days, across 629 incidents. Organizations are announcing quickly but saying little, which makes it hard for anyone else to check whether they are exposed the same way.
What I’d check this week
If you run IT for a company in Japan, two questions are worth answering before the next vendor notice lands:
- Which outside services hold your customer email lists? Newsletter tools, form builders, website builders, booking systems, alert services, survey tools. Marketing, sales and HR often signed up for their own. Write down every service and who in your company owns the account.
- Would you hear about a breach from the vendor, or from the news? Check each contract for a breach notification clause, find out which email address the vendor would contact, and confirm someone actually reads it.
If you can answer both, you’re ahead of most of the organizations in this dataset.
On 10 November the Ministry of Internal Affairs and Communications set up an expert panel to study blocking access to sites that publish leaked data. I think that effort would protect more people if it went into the systems the data is stolen from, and I’ve set out why in Japan is right to act on data leaks. Blocking won’t get it there.
The tracker has the latest figures, one row per incident with links to every source, and I update it as new notices come out. The full dataset is free to reuse with credit: you can request the CSV from the dataset page, and I send the current release on request. If your organization appears and something is wrong, tell me and I’ll correct it.
I post new figures on LinkedIn as the notices come in. If your organization wants a second look at which vendors hold your data, or who applies your updates, you can get in touch.
Matt Ketchum, MKUltraman, Tokyo